Documentation
session-analyzer turns the transcript Claude Code already wrote on your machine into one self-contained HTML report. It is a plain read of that file: no model calls, no estimates, no network.
Every screenshot on this page comes from the sample report, built from a synthetic session — no real transcript is published here.
Finding your session log
Claude Code stores one JSONL transcript per session, in a folder named after the project's absolute path:
~/.claude/projects/<encoded-project-path>/
├── 8b152b86-b864-4b17-872e-6927ad5fb37b.jsonl   ← the session transcript
└── 8b152b86-b864-4b17-872e-6927ad5fb37b/
    └── subagents/
        ├── agent-a0016685ace94ec87.meta.json    ← what the agent was asked to do
        └── agent-a0016685ace94ec87.jsonl        ← that agent's own transcript
The .jsonl alone is enough for a report. Add the folder next to it — or just drop
the whole folder — and every sub-agent gets its own row, lane and token breakdown.
On Windows the same tree lives under %USERPROFILE%\.claude\projects\.
Using the web version
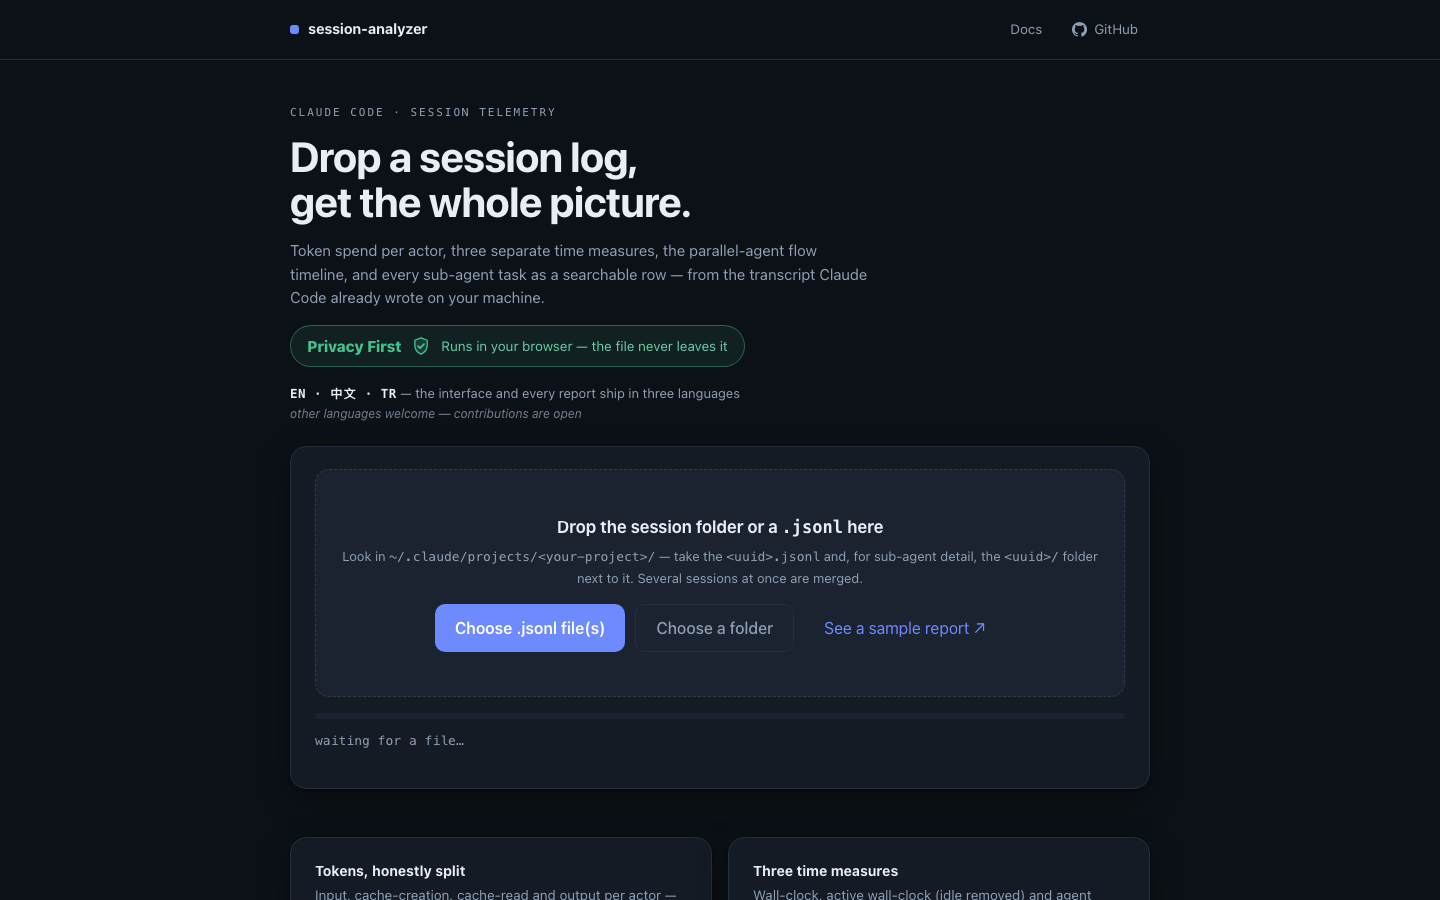
.jsonl directly. The report appears below it.- Drag the session folder (or the
.jsonl) onto the drop zone — or use Choose .jsonl file(s) / Choose a folder. - The analysis runs in the page. A large session takes a few seconds.
- The report appears inline; Download report.html saves it as one standalone file that works offline, forever, with no dependencies.
Selecting several sessions at once merges them into a single report on one time axis —
what you want when a piece of work spanned /resumes, a crash, or several days.
Because blocks are split on idle gaps, the session boundaries stay visible.
What the report shows
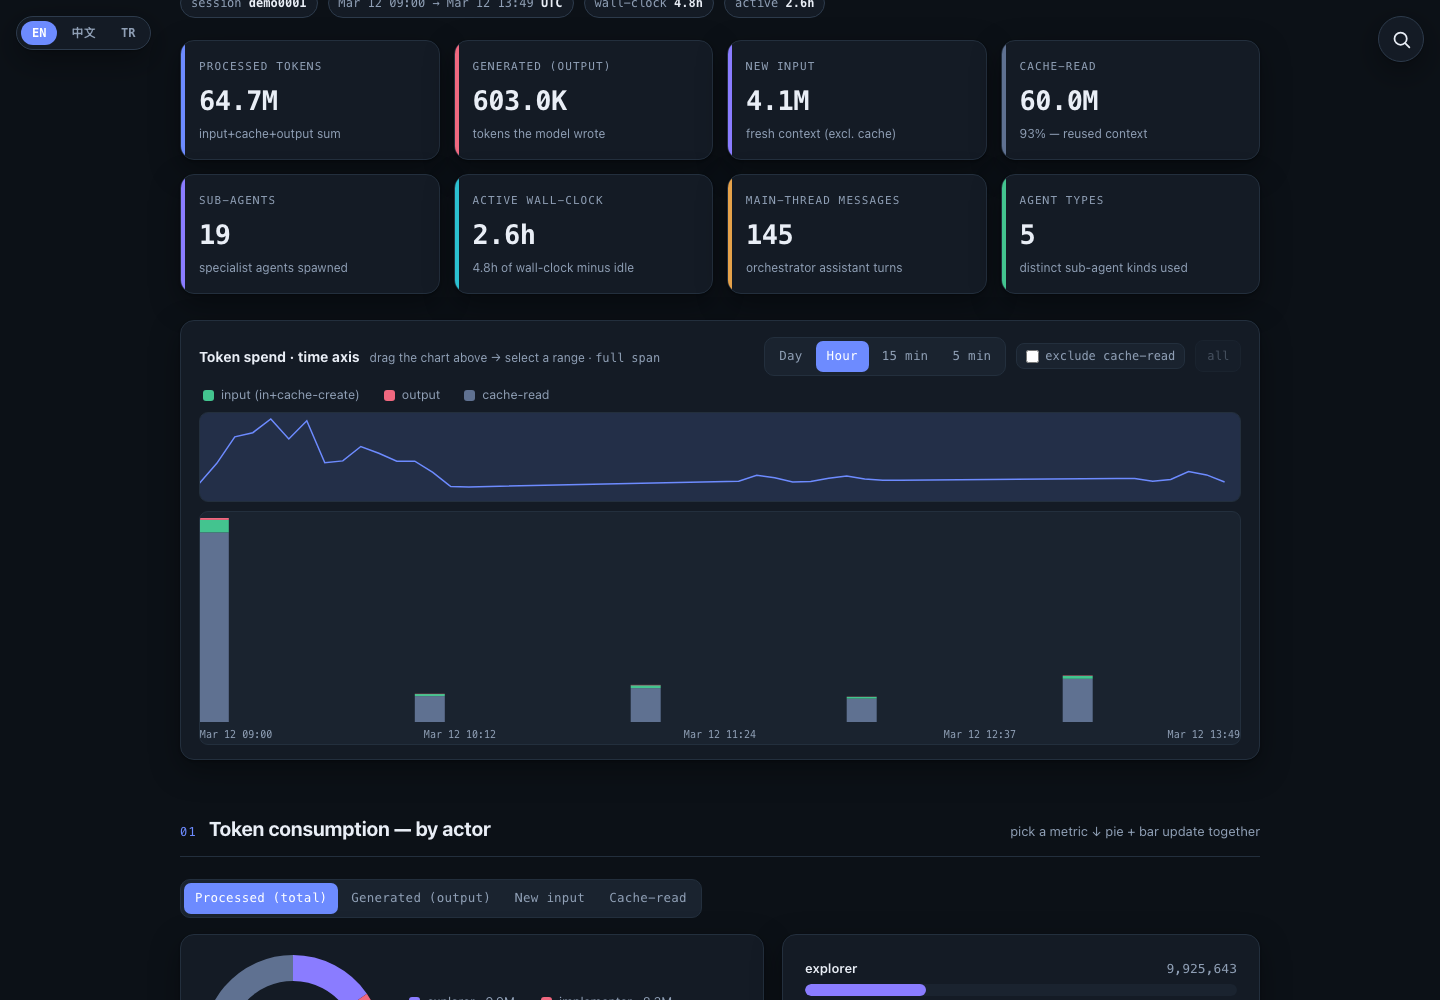
| Section | What it answers |
|---|---|
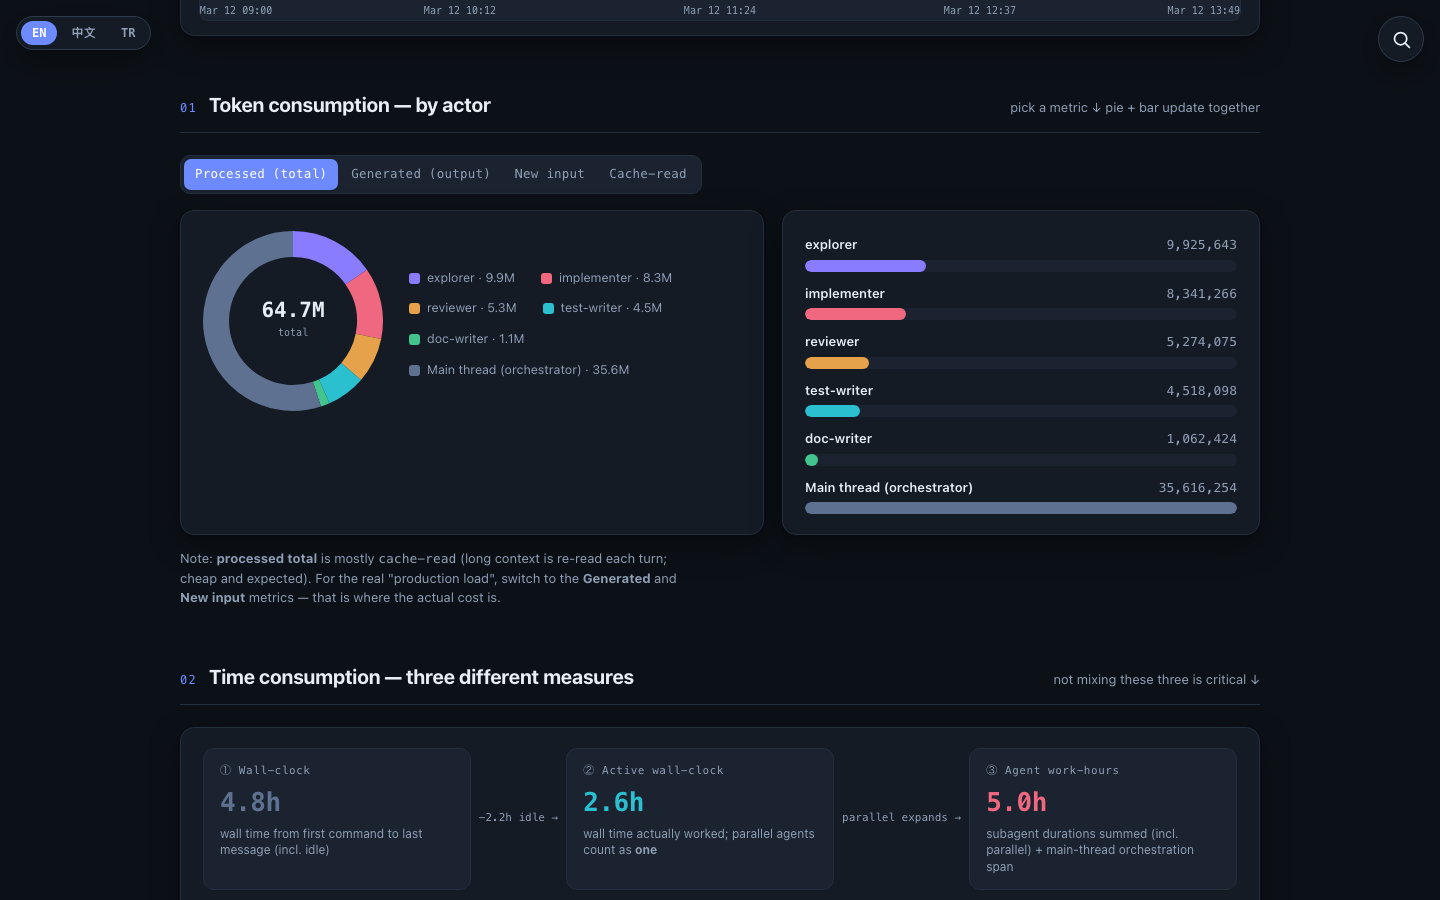
| Token consumption | Where the tokens went, split by actor — the main thread and each sub-agent type. Switch between processed total, generated output, new input and cache-read. |
| Time, three ways | Wall-clock, active wall-clock, and agent work-hours, kept separate on purpose (see below). |
| Token spend over time | A time series of every assistant message; drag to zoom into a range and read the totals for it. |
| Sub-steps | The whole run as one stacked bar: every task, biggest first. |
| Actor details | Per actor: a donut plus a table of its tasks with count, cache, output, total and time. |
| Hourly flow | The parallel-agent timeline: concurrency lanes, agent count, tokens over time, one row per actor — plus expandable activity blocks. |
| Agent / task details | Every task as a sortable row: description, model, start–end, duration, turns, tokens. Search with Ctrl/Cmd+F (regex supported). |
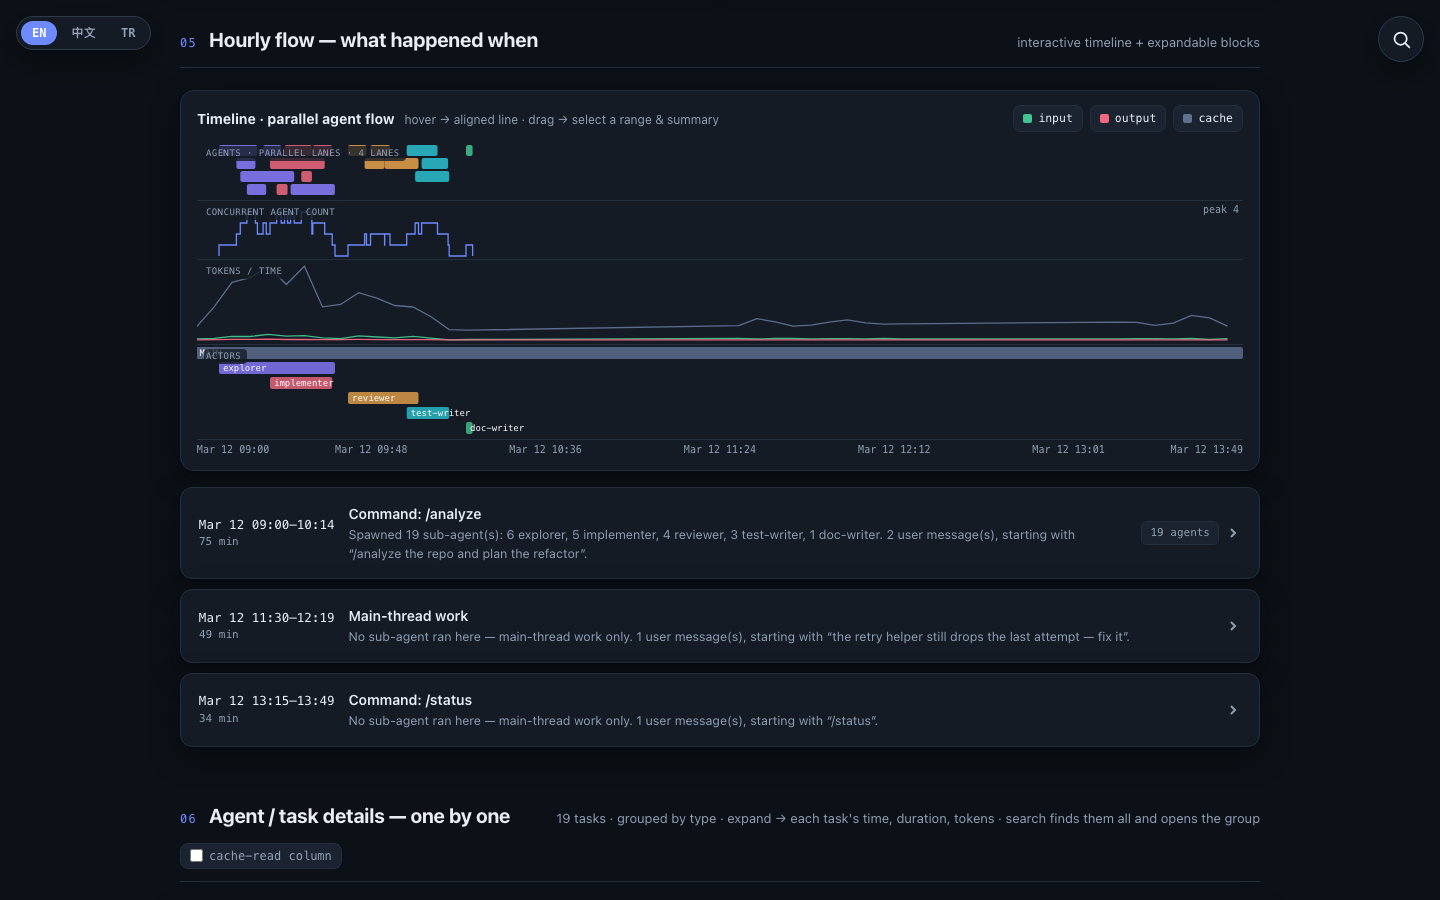
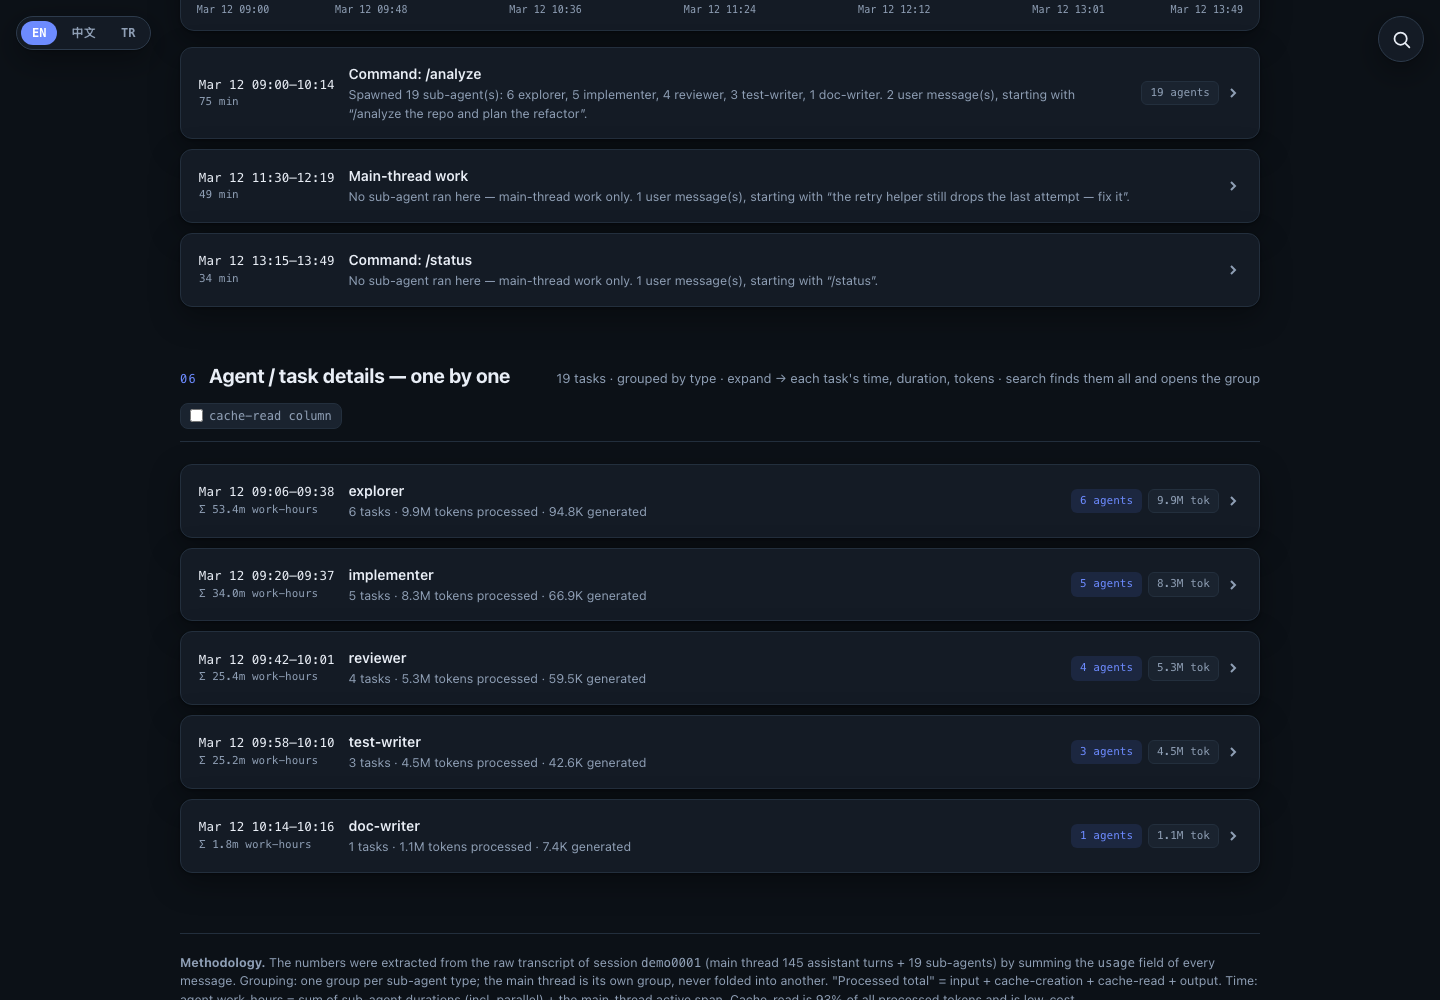
The report is trilingual — English · Türkçe · 简体中文, switchable top-left — and follows your light/dark theme.
How every number is computed
| Number | Definition |
|---|---|
| processed tokens | input + cache-creation + cache-read + output, summed
from the usage field of every assistant message. |
| generated | output tokens only — what the model actually wrote. |
| new input | input + cache-creation — context paid for at full price. |
| cache-read | context re-read from cache. Usually the majority of the total, and cheap. |
| sub-agents | one per *.meta.json under subagents/; its tokens
come from that agent's own transcript. |
| grouping | one group per agent type. The main thread is its own group and is never folded into another — it drives the whole run, so charging its spend to one type would be wrong. |
| ① wall-clock | first timestamp to last. |
| ② active wall-clock | the same span minus idle gaps: 20+ minutes in which no API call was made and no sub-agent was running. A sub-agent working silently is NOT idle — the main thread is blocked on it and writes nothing, which is why idle is measured over every call in the run (main thread and sub-agents) plus each agent's whole span, not over main-thread gaps. Parallel agents count once — it is calendar time. |
| ③ agent work-hours | each sub-agent's own duration summed (parallel work counted separately) plus the main thread's active span. |
| activity block | one working stretch: activity merged across holes shorter than 20 minutes, so blocks are separated by the idle gaps above. A user turn that arrives after 20 minutes of user silence also starts a new block — it is a new instruction. Blocks are what the hourly-flow section lists. |
Command-line version
The same analyzer runs locally without a browser, and can pick sessions for you:
git clone https://github.com/Ege-BULUT/session-analyzer
cd session-analyzer

python3 analyze_and_report.py                 # busiest session of the current folder's project
python3 analyze_and_report.py <session-uuid>  # one specific session
python3 analyze_and_report.py a.jsonl b.jsonl # several sessions, merged
python3 analyze_and_report.py --list          # what is available here
python3 analyze_and_report.py --out ./out     # where to write
It writes report.html plus report-data.json and
viewdata.json — the raw aggregates, if you want to chart them elsewhere.
There is also a local launcher with a session picker and drag-and-drop:
python3 serve_report.py # http://127.0.0.1:8799Python 3.8+, standard library only.
Privacy
The web version is a static page: your transcript is read in the browser and the analysis happens there. No upload, no cookies, no analytics, no third-party requests — the page's own Content-Security-Policy forbids them.
report.html exactly like the transcript it came from before sharing it.FAQ & troubleshooting
“Nothing usable there”
The drop contained no .jsonl. Only .jsonl and
.meta.json files are read; everything else is ignored.
The file picker will not let me select my .jsonl
Use Choose .jsonl file(s). The Choose a folder button opens a directory picker, which by design cannot select individual files.
My session has no sub-agents
Then the report is all main thread — tokens, timing and blocks still work. Sub-agent sections are simply empty.
Is a huge session a problem?
Files are streamed line by line, so tens of megabytes are fine. Very large sessions take a few seconds and a few hundred MB of tab memory while rendering.
Do the browser and CLI produce the same numbers?
Yes, and it is enforced: tests/conformance.mjs runs both implementations over the
same transcript and fails on any field-level difference.